After running two successful TikTok campaigns to promote games, I had my anecdotal data but I wondered how it compared to other game developers doing the same.
I gathered data from over 1500 TikTok videos by game studios. This analysis includes detailed stats from their best performers totalling 70 million Views. What are my takeaways?
Disclaimer: This analysis is NOT scientifically sound and the algorithm changes regularly! The videos in this data set are from January to August 2022 and the graphs include data from 144 of the top-performing videos from each studio surveyed. By "top-performing", I mean the most viewed.
active engagement
We know that TikTok will show videos to more people if they generate positive engagement. These are the four possible active engagements that a viewer can do if they like a video. Which of them correlates best with Views?
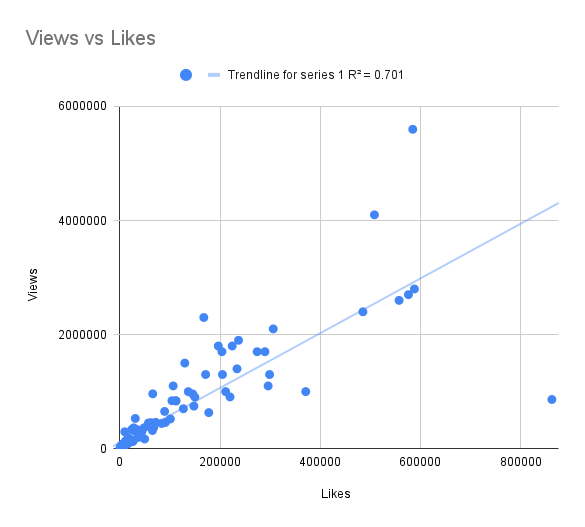
Likes: R² = 0.701
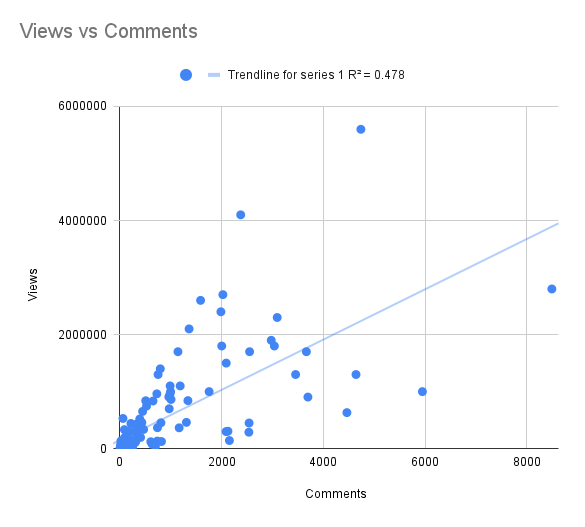
Comments: R² = 0.478
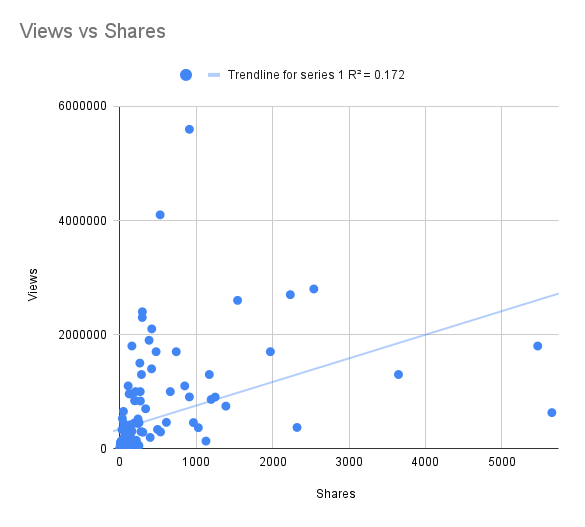
Shares: R² = 0.172
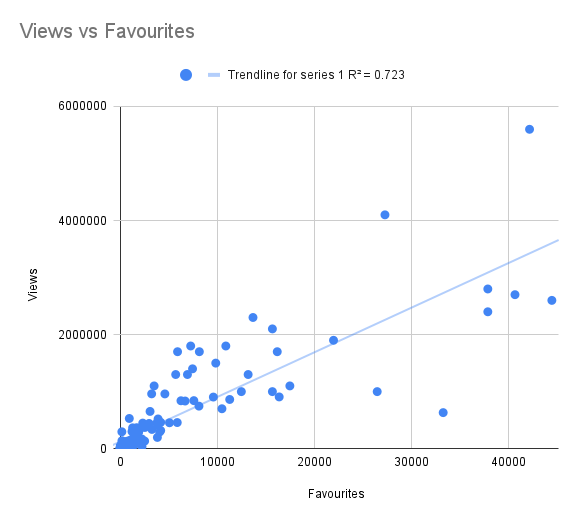
Favourites: R² = 0.723
Likes and Favourites have a strong R² correlation with Views. Comments also have a moderate correlation while Shares do not.
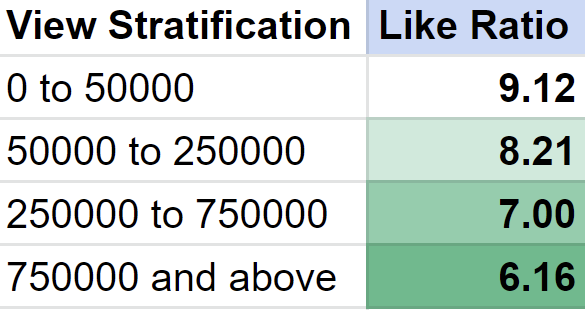
We can see this trend in what I call the “Like Ratio”. This is the number of Views divided by the number of Likes. TikTok analytics only shows data the day after a video is posted so I use this ratio as a proxy for video quality until I can see the detailed stats.
I’ve stratified the data set into 4 categories.
Videos with higher Views get Likes at a faster rate!
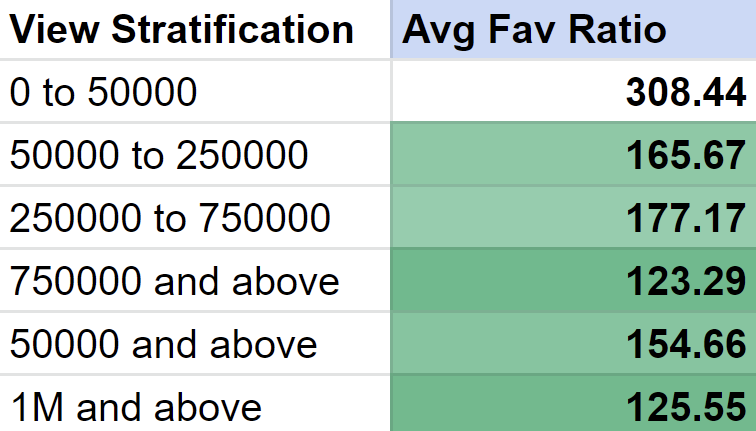
This trend is also seen in Favourites. Better performing videos are Favourited twice as often as less viewed videos.
Under 50k Views = 308 Views per Favourite
Over 50k Views = 155 Views per Favourite
Over 1 million Views = 126 Views per Favourite
So should you ask for Likes and Favourites?
I typically change my call-to-action (CTA) in successive videos and sometimes I don’t include any CTA!
Obviously, the end goal is to gain more players for your game, but this doesn’t mean sending players to Steam in every video. It takes an average of 8 touchpoints to make a sales lead. TikTok is just one channel to add to that number.
Encouraging Likes, Favourites or Comments will help your future videos reach more people and create more potential touchpoints.
WATCH TIME
TikTok wants to keep eyes on its platform so in theory, videos that retain viewers for a long time should do well. But there’s no correlation between Views and Video Length.
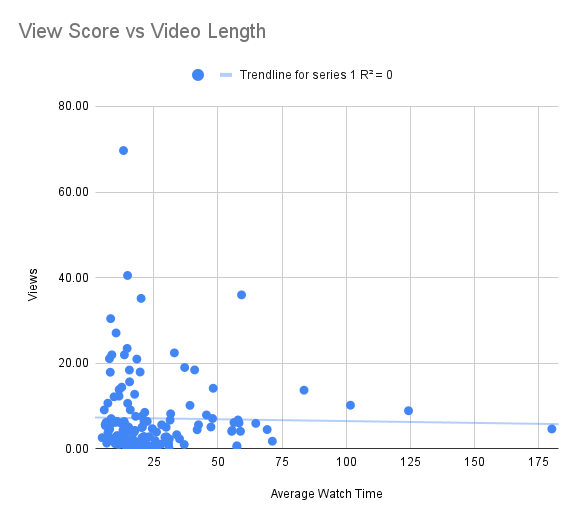
What if we try to control for each account's size? View Score is a video’s Views divided by the Average Views on that account. Still no correlation!
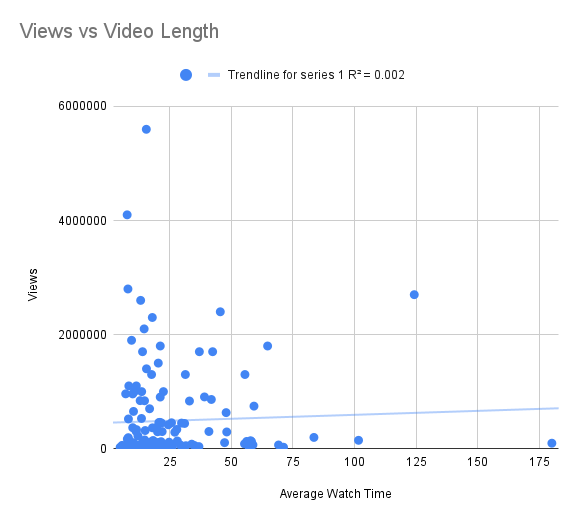
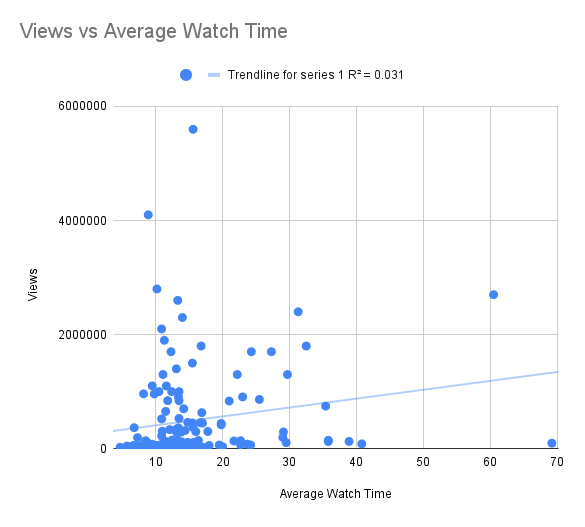
Let’s look at Average Watch Time instead. That’s how long a viewer spends watching a video (including rewatches). Once again no correlation! BUT this first graph does show something interesting.
We’re trying to find patterns in the highest-viewed videos. Ones that would appear above the clump of dots at the bottom. Unlike the other plots we've looked at, there's a largely empty segment in the upper left of this scatter plot.
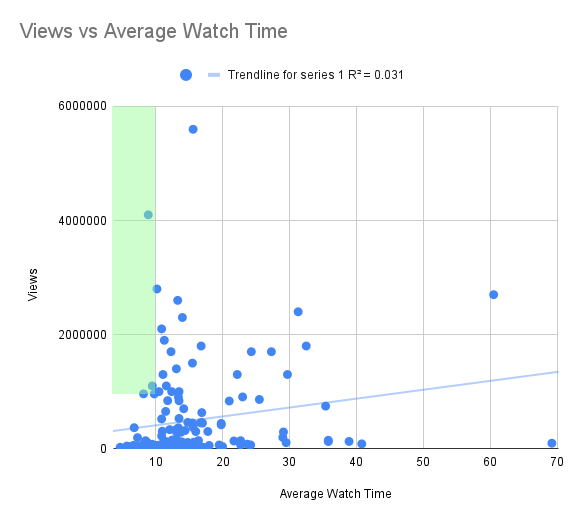
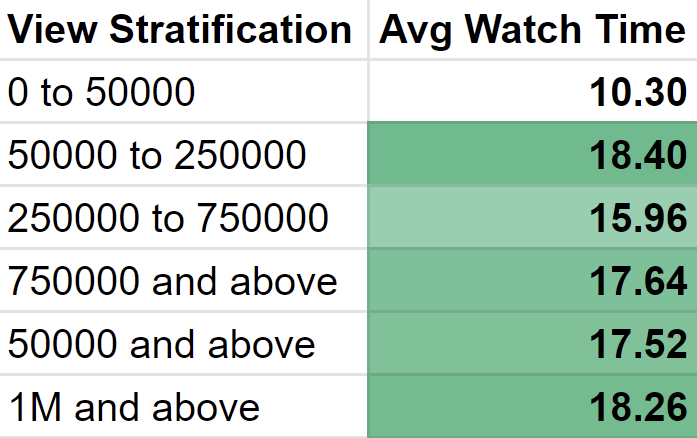
The stratified Average Watch Times show a clear delineation between videos above and below 50k Views.
Below 50k Views, Average Watch Time = 10.30s
Above 50k Views, Average Watch Time = 17.52s
Above 1 million views is even a little higher.
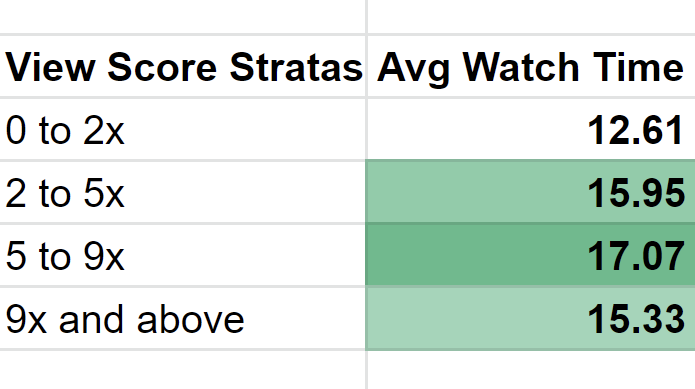
Let’s check this trend against the controlled number of Views per account.
There’s a similar delineation trend but it’s less dramatic.
Below 2x avg views : 12.61s
2 to 5x avg views : 15.95s
5 to 9x avg views : 17.64s
Above 9x avg views : 15.33s
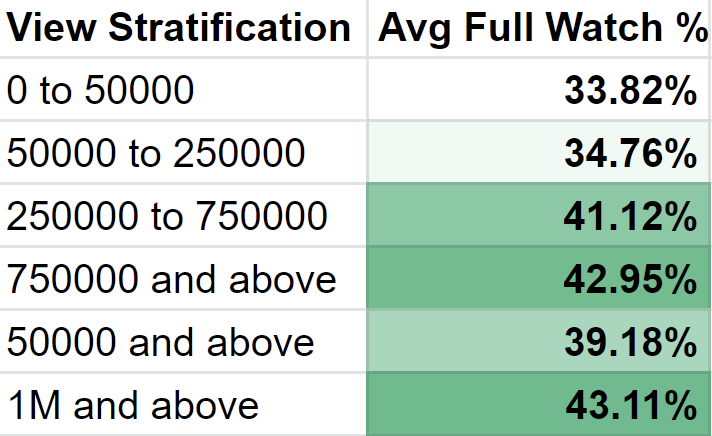
The pattern is also in Full Watch % where each stratification has a higher proportion of viewers watching to the end.
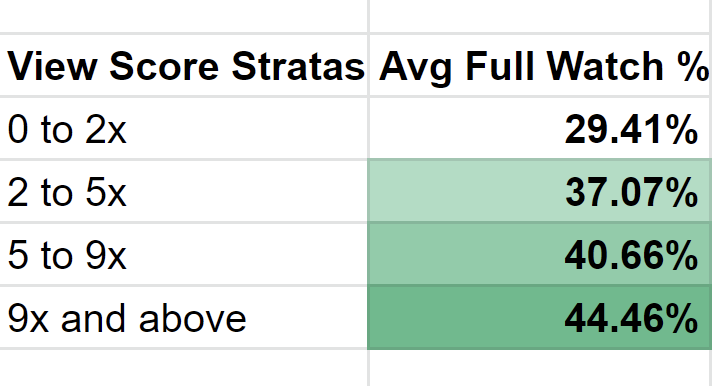
This is even more clear in the view score stratification. The best-performing videos on each account have higher Full Watch %.
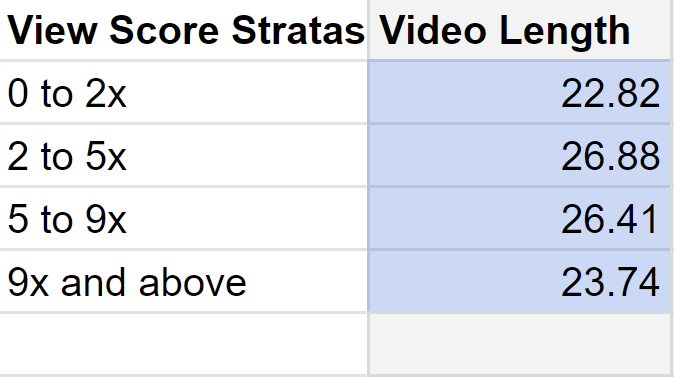
But Video Length and Full Watch % may be in conflict with each other. The longer the video, the less likely a viewer will watch to the end. There are videos that perform really well, with millions of views, ranging from 8.36s to over two minutes.
What is the sweet spot? The average Video Length below 50k views is 18.25s and above 50k it’s 28.21s
But looking at View Score doesn’t show a similar trend. This suggests that the noise of the account’s average performance is clouding a conclusion.
My takeaway is to make videos that are at least 10s long. That way, a full watch will contribute to the 50k View delineation we referred to earlier. If the video is interesting enough, the longer the better!
Remember! Everything in our data set is a top-performing video from its account.
This is the average of all videos in the data set:
489k views
25s video length
15s avg watch time
37% full watch
7.8 views per like
859 views per comment
205 views per fav
SUMMARY & CONCLUSIONS
1. Likes and Favourites have the highest correlation with views
2. Despite no mathematical correlation, videos with the most views have higher Avg Watch Time and Full Watch %
3. Videos that overperform their account size also have higher Avg Watch Time and Full Watch %
If you're interested in social media strategy to promote your game, join my newsletter! Enormous thank yous to the creators who submitted their data for this survey!